
In this article, you’ll create and share a simple Explore dashboard that reflects a common business scenario.
This dashboard shows the following information:
- For each agent in your organization, show the number of tickets assigned to them.
- Give the ability to filter the tickets by status. For example, for a selected agent, show only their tickets in a solved state.
If you need more help with anything you find, take a look at the Explore resources article.
In this step, you'll create a query that asks questions about your business data. You'll start by connecting to a dataset.
Get started
- In the Explore sidebar, click the queries icon (
 ).
). - On the Queries page, click New query.
- On the Choose a dataset page, choose Support > Tickets > Support: Tickets [default].
Query Builder opens with a blank query.

Define the query metric
The first thing you need to add is the metric for this report. This means what you are measuring. Perform the following steps to define your query metric.
- In the Metrics section of Query Builder, click Add.
- From the list of Metrics, expand Tickets, choose Tickets, then click Apply.
- Explore takes the metric you added, and automatically displays results based on it.

While simple (a count of how many tickets you have), it’s a good example of how Explore dynamically displays results based on your metrics and attributes. Now, you can add attributes to get more interesting results.
Define the query attributes
Now that you’ve defined your query metric, you’ll make this report more interesting by adding some attributes. First, you’ll add a column to the query so you can see which agents are assigned which ticket.
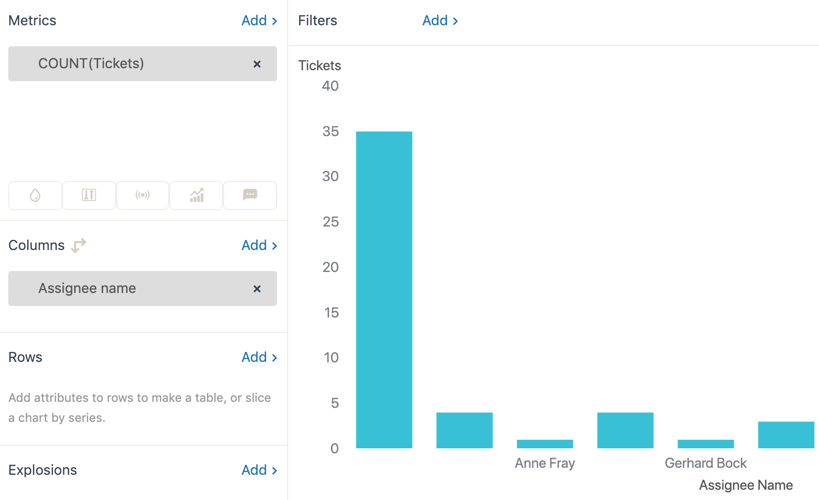
Add the assignee name
- In the Columns section, click Add.
- From the list of attributes, expand Assignee, choose Assignee name, and then click Apply.
- Once again, Explore automatically processes the change you’ve made, figures out the best way to present it (in this case, a bar graph), and displays your results.
Add the ticket status
Remember that we also want to be able to filter the results by the ticket status. For example, we might want to only display tickets for ‘Robert Stack’ with a status of Solved.
- In the Rows section, click Add.
- From the list of attributes, expand Ticket, choose Ticket status, and then click Apply.
- Once again, Explore recalculates the query and displays the results. Now, when you choose a ticket status, you’ll see only the number of tickets with that status for each agent.
Note: You can select one or more of the Ticket Status items, or select them all by clicking the Ticket Status heading.

Name the query
Explore automatically names the query when you save it. In the case of the example query above, Explore saves it as COUNT (Tickets) crossed with Ticket status per Assignee name. You can either use this name, or give the query a name of your own.
To name the query
- In Query Builder, click the query name text.
- Enter a name for the query, for example:

- Save the query. If you have previously saved it, then choose Update query.
Save the query
Now you have a completed the query, make sure that you save it. If you close your browser, or navigate to another page without saving, your changes will be lost.
- In Query Builder, click Save.
- You'll see a confirmation message to indicate your query was saved.