
If your Explore role is viewer, you can change the information you view on both pre-built and shared dashboards by using interactive widgets. Pre-built dashboards contain some of the available interactive widgets. To add additional interactivity, editors must create a new, custom dashboard.
Filtering by data values and results
You can filter results by selected attribute values or by a range of results.
This section contains the following topics:
- Filtering dashboards by attribute values
- Filtering dashboards by metric result ranges
- Filtering dashboards by top/bottom values
Filtering by attribute values
On a dashboard, you can filter by any attribute value you want to see. These filters are referred to as data filters.
This example filters the Tickets channel overview.
To filter by data values
- Open a dashboard from the dashboards library.
- Click the data filter option. The pre-built dashboard data filters will be at the top of the dashboard.
- Select your value.
If you want to exclude values, you can select the Exclude panel instead.

- Click Apply.
Your report now reflects the filter you applied.
Filtering dashboards by metric result ranges
If configured on a custom dashboard, viewers can filter reports by a specific numeric range. This type of filter is referred to as a metric filter. Metric filters are not on the pre-built dashboard and must be added by an editor to either a cloned pre-built dashboard or a new custom dashboard.
The dashboard in the example below is a customized version of the Overview pre-built dashboard with a metric filter added for Ticket created - This year.
- Open a dashboard from the dashboard library.
- In the Metric filter widget, drag the two circles until they show the result range you want to view.

All reports containing the same metric will be filtered. The metric filter above restricts Tickets created - This year results to between 180 and 280. The Tickets Created Year over Year report will only show months with results that are in this range.

Filtering dashboards by top/bottom values
If you don't want to restrict results by a certain range, but instead would only like to see the highest or lowest results you can use a top/bottom filter. Top/bottom filters are not on the pre-built dashboard and must be added by an editor to either a cloned pre-built dashboard or a new custom dashboard.
The dashboard in the example below is a customized version of the Overview dashboard with a top/bottom filter added.
- Open a dashboard from the dashboards library.
- In the Top/Bottom filter widget, enter the number of top and bottom values to display.

- Select a metric from the drop-down list.

Your report will be filtered by your top/bottom selections.
Below is the Ticket Channel overview report filtered to the top and bottom two results for First reply time (hrs).

Editing the dashboard date range
In Explore you can edit the date range a dashboard displays by using time interactive widgets.
- Selecting a specific date range
- Changing the reference date
Selecting a specific date range
In Explore, you can show results for a specific date range, using a time filter. A time filter is useful for focusing in on a specific ranges or breaking down reports with a large number of results.
This example filters the pre-built Overview dashboard.
- Open a dashboard from the Dashboards library.
- Click the date filter widget. The pre-built filters are located at the top of the page.
- Select a beginning and end date.
Depending on how the filter is configured, you will either select dates from a calendar or select a date range. The time filter on the pre-built dashboard uses a calendar.

All of your charts will only show results from the selected dates.
Changing the reference date
While time filter options enable you to select a specific date range, Explore also permits you to change the date a query or dashboard references. This feature is called Time Travel. For example if your dashboard uses the current date to represent Today, you can change what a dashboard recognizes the current date as. Time travel filters are not on the pre-built dashboard and must be added by an editor to either a cloned pre-built dashboard or a new custom dashboard.
- Open your dashboard from the Dashboards library.
- In the Time travel widget, select a new reference date.
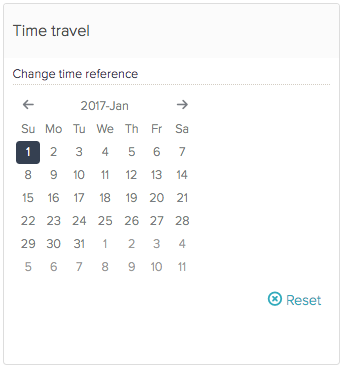
Your reports will all be updated with the new reference date.
Changing the metrics and attributes used
Reports added to a dashboard might only represent one combination of a metric and attribute. Interactivity enables you to switch the metrics and attributes used, so you can further customize what data is shown. The interactive widgets in this section are not available on pre-built dashboards. An editor must either clone a pre-built dashboard or create new, customized ones.
- Changing metrics and attributes
- Using global variables
Changing metrics and attributes
You can use change metric and change attribute interactive widgets to change the initial elements used, so you can view the different outcomes of the same report. Change metric and attribute widgets are not on the pre-built dashboard, and must be added by an editor to either a cloned pre-built dashboard or a new custom dashboard.
The dashboard in this example is a customized version of the Overview pre-built dashboard with change metrics added.
- Open the dashboard from your Dashboards library.
- In the Change metrics widget, select a new metric from the drop-down list. If you are using the Change attribute widget, select a new attribute.

You chart is updated with the new metric or attribute. Below is the Ticket Channel overview report, but with Full resolution time (hrs) changed to Agent replies.

Using what if variables
What if variables are custom attributes that can be used in calculated metrics to perform a what if' analysis. If an editor has created a report using a what if variable, you can use the variable interactive widgets to change the number the variable represents.
- Open your dashboard from the Dashboards library.
- In the what if variable widget, either drag the circle along the number scale or enter a number into the text box.

Any report using the what if variable will be updated.
Switching between filtered dashboard versions
An editor of a dashboard can save different versions of dashboards filtered states . This feature is referred to as the bookmark interactive widget. You can navigate between saved filtered states by selecting different bookmarks. A viewer cannot save a filtered state.
- Open your dashboard from the Dashboards library.
- In the Bookmarks widget, select one of the saved bookmarks.

- Click Reset under the list of bookmarks to revert the dashboard back to its unfiltered state.